
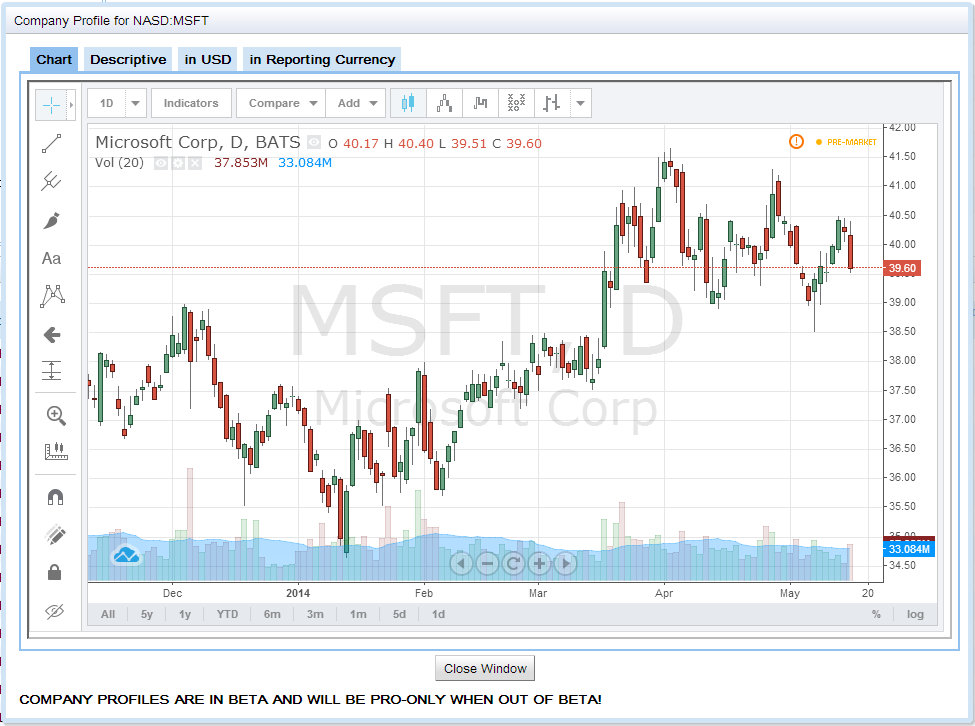
One of the common feature requests we have received over the years is to include charts and technical analysis in Screener.co. Even before we introduced our company profiles, users asked for price information and derived technical indicators to be exposed through Screener.co. Beginning today, company profiles for US exchange-traded common stocks include a TradingView interactive chart.
While this new feature is currently limited to US exchange-traded common stocks, TradingView plans to expand its coverage universe to include international markets in the near future. As new markets become available, we will embed TradingView charts in the company profiles for securities in those markets.
We looked at a number of ways to offer charting to Screener.co users and were very impressed with the functionality that is embedded in the TradingView charts. Live price updates from BATS for many securities, a library of technical indicators that can be plotted in the charts, and multiple drawing tools make TradingView charts a robust new addition to the Screener.co platform.
Having complemented Screener.co’s fundamental data and native analytical capabilities with TradingView’s advanced charting and technical analysis tool, we are confident that Screener.co is the best low-cost equity research platform in the market.
